Methodology — Where do
the figures come from?
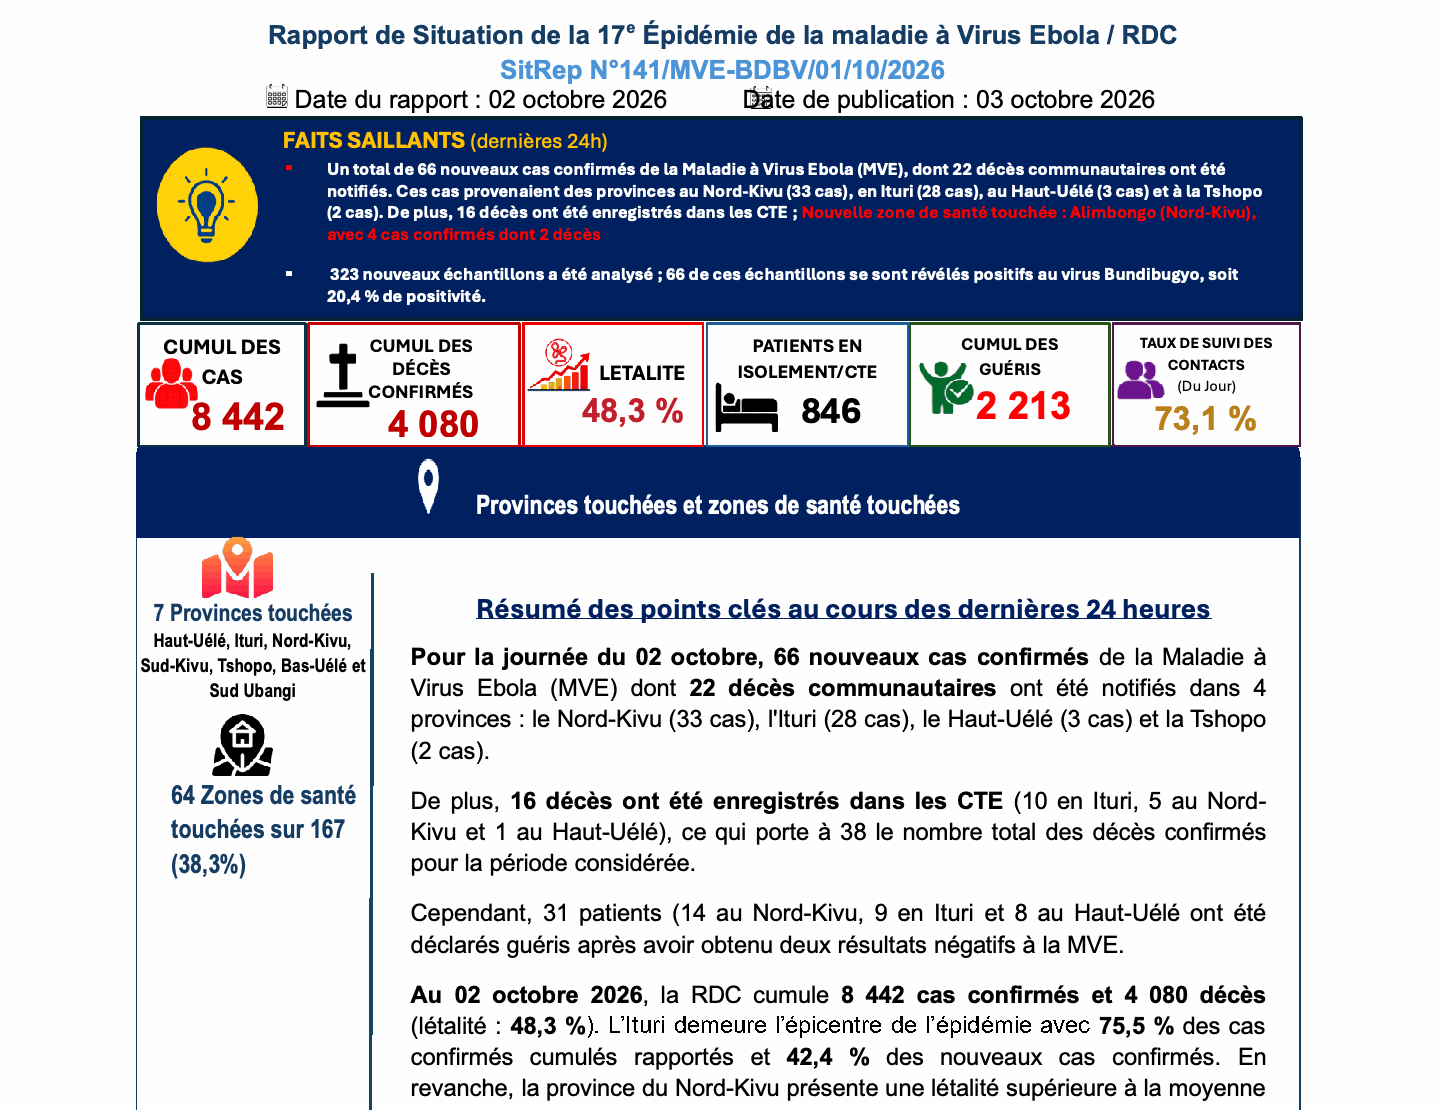
This site produces no figures of its own. Everything it shows was read in an official bulletin from the National Institute of Public Health (INSP), archived and available. To show it, here is one bulletin, and what the site does with each of its figures.
 1
2
3
4
5
6
1
2
3
4
5
6
- 18,442confirmed cases as of 2 October 2026
The bulletin gives it twice: in the banner and in the summary. The site checks that it also matches the sum of the seven provinces in the table: 6,370 + 1,657 + 352 + 48 + 10 + 3 + 2 = 8,442.
- 24,080confirmed deaths
Same check: banner, summary, then the sum of the provinces — 2,933 + 979 + 146 + 16 + 4 + 1 + 1 = 4,080.
- 348.3%case fatality rate
The site does not copy this rate: it recalculates it, 4,080 ÷ 8,442 = 48.3%. If it did not match the published figure, the gap would be flagged.
- 466new cases in the day
The site checks that they match the gap between two totals: 8,442 in No. 141 minus 8,376 in No. 140, that is 66. It is the 2 October bar in the new-cases chart.
- 52,213recovered in total
The summary reports 31 patients declared recovered that day; the total goes from 2,182 (No. 140) to 2,213. The two agree.
- 664 / 167health zones affected
The site finds each of these 64 zones in the bulletin's health-zone table, then places it on the map. A name spelled differently ("Gety" or "Gethy") is matched, never guessed.
From bulletin to chart
- 01
The bulletin is archived
Every PDF published by the INSP is downloaded and kept as is, as are the WHO weekly reports that complete some of the series. The original stays available — that is what makes the figures on this site checkable.
- 02
The reports are read
A program reads the PDF's tables, then every report is read in full — including the prose around them, whose wording changes from one bulletin to the next and which sometimes carries figures the tables leave out. Checking is therefore manual as well, bulletin by bulletin. A value that does not reconcile is dropped rather than approximated.
- 03
The site is updated
With every new bulletin, every page of the site is remade with the new figures. What you read here is exactly what was checked against the bulletin — nothing is recomputed when you open the page.
In detail
What you need to know to read and reuse the site's figures.
How to read these figures
Confirmed cases and deaths are totals since the start of the outbreak. Only new cases and deaths — the “24h” columns, or “(+…)” on the map — are daily figures, announced by the latest bulletin. The fatality rate covers confirmed cases only, and the outcome of the most recent cases is not yet known: it describes the severity observed so far, not an individual's risk of dying from the disease, and it will keep moving. New cases (24h) is taken as published in the latest bulletin — so it does not always match the gap between two successive cumulative totals, since retroactive revisions land in the totals but not in that figure.
Two known limitations. National figures are sometimes published before the province and health-zone breakdown, so a temporary gap between levels is normal. And the authorities sometimes revise figures retroactively — those revisions are reflected here as they come, unsmoothed.
Data sources
The figures shown come from the bulletins of the DRC's National Institute of Public Health (INSP), occasionally supplemented by World Health Organization (WHO) reports. Both sources are archived and available on the Sources & bulletins page.
Methodology
This site is powered by a tool that's actively developed and supervised: it fetches each newly published SitRep and extracts the key figures (confirmed cases, deaths, recoveries, breakdown by province and health zone), generally once a day. Every report is then read in full — the tables as well as the prose — and the extractions are checked by hand, bulletin by bulletin, with manual correction when needed (a bulletin's layout changing, fixing a numbering error, etc.). The WHO weekly reports are read the same way and are used to complete the series the INSP SitRep does not cover. Data may be revised retroactively by health authorities (harmonisation between provinces, reclassification of community deaths): such revisions are reflected on the site automatically as soon as they're published.
Known limitations
Official reports mix data at different levels of detail (national, provincial, health zone), sometimes in different formats, which can occasionally produce minor inconsistencies or approximations. National figures are also sometimes published before the province and health zone breakdown, causing a temporary lag between these levels.
Update frequency
As soon as a new bulletin is published, it is checked and the site is updated. Checking the data takes less than 24 hours. The date of the latest bulletin included is shown at the top of every page.
Access to the data
All the data shown on this site comes from the official bulletins archived in the Sources and bulletins section, where each one can be read as its original PDF.
Disclaimer
This site is strictly informational. It compiles and formats public data already published by official sources, without independent analysis or interpretation. It is not medical, epidemiological, or geopolitical advice of any kind, and should not be used as the basis for a health, travel, or safety decision. For any medical question, consult a health professional or the relevant health authorities (WHO, DRC Ministry of Health). Despite our best efforts, errors, approximations, or update delays are possible.
Found an error, got a question?
Corrections are welcome. Contact →
Follow the site
New pages and situation updates are announced on X: @EbolaTrackerRDC